
Objective: To collect and analyze meaningful personal data and create relevant insights. Further create an inspired tangible representation of the data.
Constraints: A complete set of data must be available.
Data analyzed of my
Instagram Saves
for 2023 January-August.
To create an understanding of my mindset, interests, and behavioral patterns throughout the course of a semester.
1
Collect relevant data
2
Visualize and Represent
3
Generate insights
4
Data Representation
5
Prototype
Phase 1
Data Collection
The first step was manual collection and categorization of the data from my Instagram account. The purpose was to identify the emotions and timeline throughout the months that were being traced. This would create a clear pattern that would reflect the events in my life during each particular month.
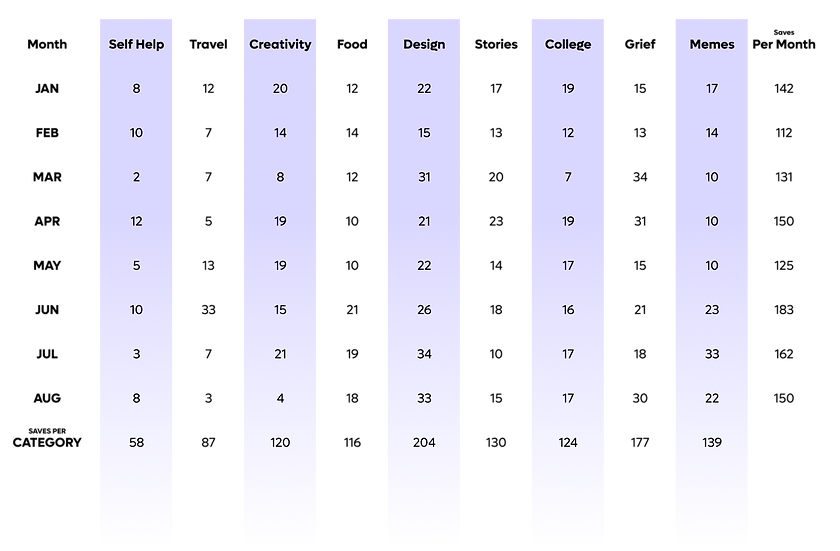
Since the data is personal, the categories are a subjective representation. The given chart is a small example used to showcase the nature of saved posts. The entire data set was collected on a Google Sheet for analysis.


Phase 2
Visual Representation
posts saved from January to August, 2023.
1155
In the next phase, the data had to be primed for analysis and visualization. Leveraging tools like Illustrator and RawGraphs, the timeline of events and saving trends was traced through various types of data visuals.

Visualizing category-wise saving trends by month.
.png)
Visualizing category-wise saving trends by month.

Phase 3
Insights


Phase 4
Data Representation
Conceptualization of the tangible representation of the resultant data in an artistic manner was developed through sketches and trial and error. Here's what I came up with!


PHASE 5: THE PROTOTYPE
Jan- Aug '24 Calendar
Recycled handmade paper cards- 120 GSM
14.5 cm x 8 cm
